If you've been in NYC recently, you know that the city has instituted a new method for monitoring food safety. Since July 2010, restaurants have been graded on a points scale.
Like in golf, restaurants try to score as low as possible in order to get the best letter grade: an A. The scores convert to grades as follows:
A: 0-13 points
B: 14-27 points
C: 28 points or more
Restaurant owners, unsurprisingly, haven't been huge fans of the system, but consumers user it- one survey shows 88% of New Yorkers use grades to make decisions. There's anecdotal evidence that low grades are bad for business, and hilarious but probably fake pics of restaurants hiding low ratings.
The one thing that has struck me about the grading system is the number of pending grades. Inspections take one day, and by my count in 18 months there have been enough inspections to cover each restaurant 3 times (data here). And yet, about 1 in 7 restaurants, well over 3,000, still have grades pending.
If you don't like the grade, get another
Pending grades exist because most inspections are never graded. The city's scoring guide lists the following:
The following are scored but not graded:
- Initial inspections that result in a score of 14 points or higher
- Monitoring inspections at a restaurant that has performed very poorly on its re-inspection. The Health Department may continue to inspect the restaurant roughly once a month until it scores below 28 or the Department closes it for serious and persistent violations....
- Some inspections in response to complaints
So for any inspection that isn't good, the restaurant has a chance at a second inspection. If that goes poorly, the restaurant may have additional chances to improve its score. And NONE of the negative results impact the restaurant's score: only the best score is used to calculate the grade.
Using the Tableau Public, and NYC data (props to the city for making it available), I whipped together a look at all the different inspections since July 2010. Some of the results were pretty absurd.
Take the Barclay at the Intercontinental Hotel. Here are its scores over time:
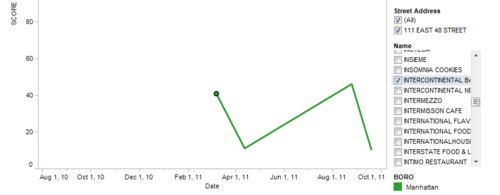
In March of 2011, the restaurant scored a 41- a bad C. According to the violation list at NYC Health Ratings (a great resource), violations included live roaches and filth flies. No grade was assigned: instead the inspectors came back a month later and found the kitchen in better shape, awarding a B.
This would be a great turnaround story, except 4 months later in August, inspectors came back again and found the kitchen in even worse shape than before: the roaches and flies were back, and in addition there was 'evidence of mice or live mice present'. The facility was given a 46- again, well into C territory.
No grade was given. Three weeks later, the inspectors came back again and found the place in great shape, with only one major violation (food not being kept cold). The restaurant's grade was raised to an A.
(I should say here that this restaurant has done nothing illegal or unfair. If I was in their shoes, I certainly wouldn't turn down the A. But assigning an A here is, in my mind, misleading.)
Regardless, situations like this have not strengthened my faith in the grading system, but I am impressed with the records that have been kept. So I've built an alternate grading system based on the average score across all inspections. It's a really basic way of looking at the restaurants, but I figure that I don't know whether the kitchen is going to be having a good day or a bad day when I walk in, so I'd better consider the entire range that has been observed. If you want to see average ratings, they are here
Below I've put together a simple tool for you to see the historical ratings of every restaurant in the city. I've selected all the McDonalds in the city as a starting point- feel free to adjust by manipulating the filters on the right. The background colors match the city's grading scheme- the green region is an A, yellow a B, red a C.
